PGAV Destinations publishes its second report on guest insights – Voice of the Visitor: 2017 Annual Outlook on the Attractions Industry.
 We are thrilled to publish our second Voice of the Visitor: Annual Outlook on the Attractions Industry, conducted by PGAV Destinations in conjunction with H2R Market Research and Blooloop.
In its inaugural year, Voice of the Visitor 2016 generated a unique buzz and enthusiastic interest from the attraction industry, as it is the only industry report produced by gaining insights directly from visitors across so many attraction types. Our greatest strengths in strategy and planning lie in better understanding the guests we serve, and nothing matches gaining those insights directly from the source.
Voice of the Visitor 2017
 The 2017 Voice of the Visitor study was done by polling 1,500 U.S. leisure attraction visitors who have either visited an attraction in 2016 or are open to doing so in 2017. The purpose of this study is to provide an industry-standard dashboard that quantifies aggregate attractions’ industry performance and presents a forecast for immediate-future visitation. We’re excited by the prospect of having two years’-worth of data so that we can begin developing and analyzing trend lines, increasing the value of the full report with each installment.
Just as in 2016, 86% of our respondents plan to travel for leisure this year. Millennials will be key drivers in this attendance growth, and this projection is expected to continue as more of Generation X, Baby Boomers, and Matures intend to hit the road. Those attractions expected to see the most robust attendance growth of 3% or more include Aquariums, Zoo and Animal Attractions, Botanical Gardens, Family Entertainment Centers, and Theme Parks.
 While attraction guests overall are more optimistic than not (40% vs. 25%) about a healthier economy, that level of optimism is down by two points since last year. From pop star passings to natural disasters, political turmoil to civil unrest, 2016 was a consistently tumultuous year for people around the world. 2017’s Outlook on the Attractions Industry study was conducted prior to the results of one of the most uncertain and contentious American presidential elections in history. However, the environment created by this year’s political race had a clear and present impact on consumer attitudes, temperament, behavior, and outlook on 2017.
Due to last year’s political ecosystem, nearly a third (30%) of our respondents noted that they delayed long-haul trips, 20% delayed overseas trips, 18% moved their investments to protect them, and 7% reduced their 401(k) contributions.
Just as in 2016, Aquarium visitors remain the most economically-optimistic guests, followed by Theme Park and Large Format Theater patrons; whereas in 2016 runner-up optimists were Botanical Garden and Art Gallery guests.
Zoos and Aquariums
Zoos/Animal Attractions had one of the highest rates of visitation in 2016, with 45% of our respondents having patronized one last year (up one percentage point over 2015). Aquariums hosted quite fewer of our respondents, with only 28% having attended one, down two percentage points from 2015.

For those guests who said they were repeat visitors, or had been to the last Zoo or Aquarium they visited before, Zoo/Animal Attractions were the only attraction type to not have any change from 2015, with a massive 81% of guests having been repeat patrons. Aquariums experienced the largest drop in this category of 18 points to 42%.
In this year’s study, we witnessed a correlation between overall concern of the US political environment and a universal drop in guest satisfaction. On a five-point scale, Zoos/Animal Attractions had a satisfaction score of 4.3, while Aquariums had the lowest satisfaction of 4.24, although the overall range is just .32. Just as in 2015, Aquarium guests remain the  most economically-optimistic attraction goers, with half of them feeling that the US economy will improve in the coming year, while Zoo/Animal attraction guests’ optimism rose by two points to 40%.
Aquariums have the highest projected attendance growth in 2017 of 4.4%, while Zoo/Animal Attractions also promises one of the highest growth rates at 2.9%. Zoo/Animal Attractions also have one of the highest intents to return to the same one in 2017 at 4.3 (on a five-point scale). If considering local partnerships, 2016 Aquarium guests are most likely to also visit Zoo/Animal Attractions and Historic Landmarks in 2017, while Zoo/Animal Attraction guests are most likely to also visit Museums and Historic Landmarks.
Themed Entertainment
With little change over 2015, 37% of our respondents visited a Theme Park and 22% visited a Water Park in 2016. Two thirds of those who visited a Theme Park did so while traveling more than 50 miles from home, up five points over 2015, while Water Park distance-visitors dropped nine points to 51%.

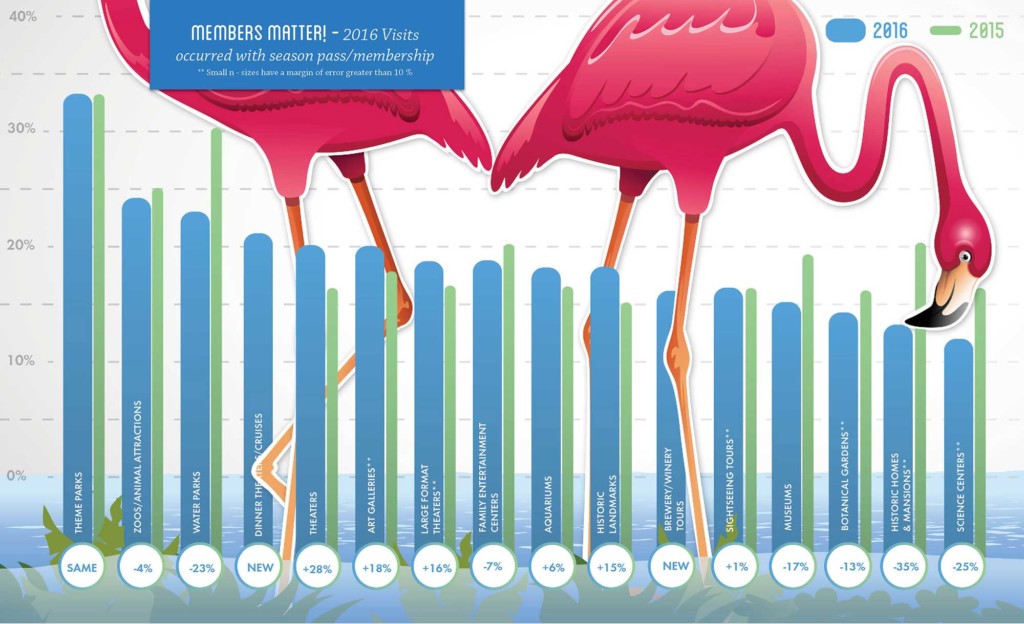
Theme Parks and Water Parks maintain two of the strongest incidences of season pass utilization with one third of guests using their Theme Park season pass and 23% using their Water Park season pass during their most recent visit. Theme Park repeat visitation rose two points over 2015 to one of the strongest rates at 86%, while Water Park repeat visitation fell by two percentage points to 65%.
Both Theme Park and Water Parks held some of the lowest guest satisfaction, at 4.26 and 4.24 respectively on a five-point scale. More than half of guests tend to still recommend these Theme Parks and Water Parks to family and friends though, at 55.3% and 52% respectively. Theme Park guests are some of the most optimistic about the US economy with 47% expecting it to improve, while Water Park guests had a 10 percentage point decrease to 44%.
Theme Parks have one of the highest projected attendance growths in 2017 at 3.6%, and also the largest categorical improvement over 2016 by 2.8 points. Conversely, Water Parks are one of the only two attraction types forecasted to see a decrease in attendance, of .7%, a loss of 4.5 percentage points from last year. 2016’s Theme Park Guests are most likely to also visit FECs and Zoos/Animal Attractions this year, while Water Park guests are likely to also visit Theme Parks and FECs.
Museums and Science Centers
Museums had the highest rate of visitation in 2016 among our respondents at 48%, a three-point growth over last year, while Science Centers had one of the lowest rates of visitation at 19%, albeit a two-point rise from last year. Of those respondents, both attraction types had an average rate of visitors from more than 50 miles away, with 50% for Museums and 48% for Science Centers, both decreasing from last year.
 Science Centers had one of the lowest rates of membership utilization at 12%, while Museums were also below average at 15%, both a decrease from 2015. However, Science Centers had one of the strongest incidences of repeat visitation at 87% with one of the strongest rates of increase by 20 percentage points, while Museums were average at 62%, but with a very strong 19 percentage point growth rate.
Guest satisfaction at Museums and Science Centers is solidly average at 4.32 and 4.34, respectively, on a five-point scale. Similarly, both attraction types are average regarding the rate at which guests would recommend them to friends and family, with Museums at 52% and Science Centers at 54.2%, although Science Centers had the largest rate drop over the previous year by 18.8 points. Lastly, these guests are also averagely-optimistic, with 42% of Museum guests and 36% of Science Center guests believing the US economy will improve this year.
 Museums have made a great turn-around in projected growth this year of an average score of 1.8%, as they were the only attraction type projected to have a decrease in attendance in 2016. Science Centers have a much smaller projected growth rate of .4%, down 1.4 points from the previous year.
History and Culture
Historic Homes and Mansions had the lowest rate of visitation from our respondents and no change from 2015 at 15%, while Historical Landmarks rose five percentage points to one of the strongest rates of visitation at 45%. Both types of attractions welcomed some of the highest rates of visitors from over 50 miles away, with Historic Homes and Mansions at 62% and Historic Landmarks welcoming the highest increase of 19 points to 77%.
Some of the lowest incidence of membership utilization are recorded for both attraction types, with Historic Homes and Mansions at just 13%, down seven points from 2015, and Historic Landmarks increasing by two points to 17%. Both also have the lowest incidences of repeat visitation, with just 40% of visitors having been to the same Historic Home and Mansion before, and 34% of visitors having been to the Historic Landmark previously.
Historic Homes and Mansions have some of the highest guest satisfaction at 4.35 while Historic Landmarks are solidly average at 4.32 on a five-point scale. Guests of Historic Landmarks are the least optimistic about the US economy, with only 26% feeling that it’s likely to improve (down 13 points from last year). Guests of Historic Homes and Mansions are averagely optimistic at 40%.

Both attraction types project growth, although below average and lesser than in 2016, with 1.8% for Historic Homes and Mansions and 1.7% for Historic Landmarks. Intent to return to the same attraction is among the lowest for both types, with Historic Homes and Mansions at 3.17 and Historic Landmarks at 3.03 on a five-point scale. If seeking cross-promotion, 2016 Historic Home and Mansion guests are most likely to visit Museums and Historic Landmarks in 2017, while Historic Landmark guests are most likely to seek out Museums and Theaters.
Read the Voice of the Visitor Report
Read the full report here and see PGAV Destinations full library of insight reports here.