Disney, China and indoor entertainment centres have fuelled a return to historic levels of growth for the theme park industry in 2017, according to the latest Theme Index and Museum Index report.
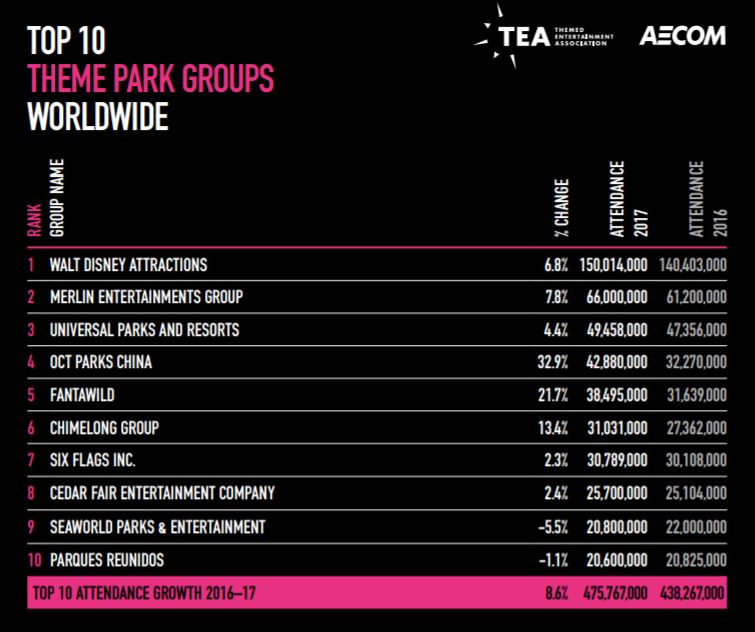
Following a year of mixed results in 2016, the industry has seen massive growth in 2017. The report, produced by the Themed Entertainment Association (TEA) and AECOM, shows that major theme park operators experienced 8.6% overall growth while the top 25 theme parks expanded volume by 4.7%.
China was a major factor in the uptick, with visitor numbers at the country’s parks increasing by nearly 20%. It now generates approximately a quarter of overall attendance for major operators.
“The Chinese market has responded enthusiastically to high-quality theme park offerings, as demonstrated by the success of the Chimelong parks and of Shanghai Disneyland in its first full year of operation, with Universal Beijing on the horizon,” said Chris Yoshii, vice-president for Asia-Pacific at AECOM.
Asia as a whole saw attendance expand by 5.5%. Korea saw a decline in attendance, attributed to the geopolitical climate that discouraged tourism. Parks in Japan received a small increase in visitation while Hong Kong had mixed results with its Disneyland seeing attendance stabilise at 6.2 million as Ocean Park experience a 3% decline.
In the US, theme parks and amusement parks had a good year and showed that there is still room for growth and innovation in a mature market.
Disney and Universal both performed well due to major reinvestments such as Pandora – The World of Avatar and Volcano Bay.
“Disney is leveraging the power of compelling intellectual property (IP) with Pandora – and new Star Wars lands on the horizon – as did Universal with the Harry Potter attractions, and both set a leading example for the industry,” said Brian Sands, AECOM’s vice-president for the Americas.
In Europe, parks in France, the Netherlands and Northern Europe did particularly well, with mixed results in other regions.
“Throughout Europe, we see an active and growing industry with ongoing investment and merger and acquisition activity,” said Margreet Papamichael, director for EMIA at AECOM.
She added that theme park development continues in the United Arab Emirates, with the pipeline in that part of the world still significant.
Global water park attendance saw a small growth of 1.6%, driven by strong performances in some of the European parks. The top 20 parks in North America had a poor year, attracting 500,000 or 2.9% less visitors than 2016.
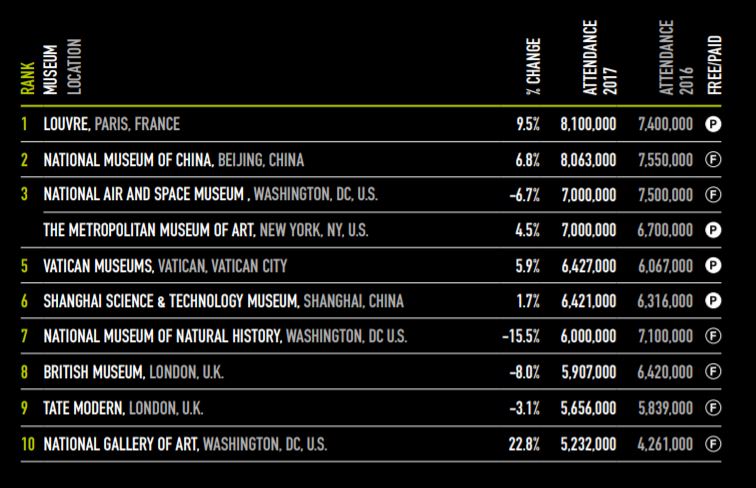
The Museum Index shows that the Louvre recaptured the top spot as the most visited museum in the world, knocking the National Museum of China back into second place. The French museum experienced a 9.5% visitation increase taking its overall figure to 8.1 million. The National Museum saw a 6.8% increase but welcomed 37,000 people less.
The top 20 museums were relatively flat overall but regional museums had a strong year with 5% growth fed by some new entries and strong performance in Asia. Several museums had remarkable years such as the Victoria and Albert (V&A) with a 25% increase and the National Gallery of Art with a 23% rise.
“Data continues to demonstrate that year to year museum attendance is significantly affected by special exhibits and expansions,” said Linda Cheu, vice-president for the Americas at AECOM.
The report identified several global trends. The development of immersive attractions based on IP is ongoing and being explored globally. Other trends seen in all regions include continuing investment and innovation in water parks, hospitality expansion and interactive guest experiences with role playing.
John Robinett, senior vice-president at AECOM, said: “On the whole, 2017 reflected a return to healthy growth with significant capital expenditures in the industry, both in traditional attractions, attraction-adjacent hotels, and new, IP-branded indoor attractions.
“With stabilised global economies, and significant planning occurring now for future investment, prospects look good for the industry in the short- to mid-term.”
Key figures from the 2017 Theme Index and Museum Index
- 476 million visits to attractions run by the top 10 global theme park groups, up 8.6%.
- 244 million visits to the top 25 amusement/theme parks worldwide, up 4.7%.
- 151 million visits to the top 20 amusement/theme parks in North America, up 2.3%.
- 134 million visits to the top 20 amusement/theme parks in Asia-Pacific, up 5.5%.
- 108 million visits to the top 20 museums worldwide, up marginally by 0.2%.
- 76 million visits to the top 20 museums in Europe, Middle East and Africa, up 1.1%.
- 67 million visits to the top 20 museums in Asia-Pacific, up 13.3%.
- 63 million visits to the top 20 amusement/theme parks in Europe, Middle East and Africa, up 3.4%.
- 59 million visits to the top 20 museums in North America, up 1.0%.
- 30 million visits to the top 20 water parks worldwide, up by 1.6%.
Download a copy of the Theme Index and Museum Index 2017.
Images: c. TEA/AECOM Theme Index and Museum Index 2017.