ROLLER, a powerful all-in-one venue management platform that includes POS, CRM, memberships, and more, has launched its first Attractions Industry Benchmark Report. As 2025 approaches, the global attractions sector is experiencing some significant changes. As operators make plans for long-term success, they must consider changing guest expectations and new economic challenges.
ROLLER has created a new benchmark report with hundreds of thousands of data points to assist venues in navigating this. This can help expanding attraction companies understand how they're doing in relation to the market as a whole, what their customers expect, and how they may increase their revenue. This paper aims to offer practical insights that can help venues prosper and remain competitive in a continuously evolving market.
 Luke Finn
Here, we examine some key findings from ROLLER’s Attractions Industry Benchmark Report and speak to CEO Luke Finn and field general manager and ex-operator Brett Sheridan to understand what they mean for operators.
Why now?
The year 2024 marks another pivotal moment for the global attractions industry. With the pandemic in the rearview mirror and new challenges emerging, including economic uncertainties and evolving visitor expectations, operators must stay agile and informed. As the industry continues to rebound and innovate, having the right insights and resources is more critical than ever for sustaining growth and enhancing the guest experience.
Speaking about the goal of this new report, Finn says:
“One thing we love about the attractions industry is that operators are extremely collaborative and help each other out when they can. Our goal is to honour these collaborations and bring the community together so the industry can thrive together.”
The ROLLER Attractions Industry Benchmark Report
To create the Attractions Industry Benchmark Report, the team gathered and anonymised ROLLER data from 1 July 2022 to 30 June 2024. This included transaction data, booking trends, repeat visitation rates and survey responses from operators.
Data has been grouped into three regions: EMEA (Europe, the Middle East and Africa), APAC (the Asia-Pacific region including countries across East Asia, Southeast Asia and Oceania), and AMER (the Americas, including both North America and Latin America). Throughout the report, the data shows key stories about guest behaviour, emerging trends, and areas where attractions can differentiate themselves.
 Brett Sheridan
The main topics explored are booking and spending behaviour; parties, groups and memberships; payments; and feature usage.
See also Real, actionable insights with ROLLER Analytics
Booking and spending behaviour
In this section of the report, readers can find out how they compare to others for bookings and learn more about guest spending behaviour. They will be able to take away insights about optimising booking channels and increasing revenue.
Understanding guest booking and spending behaviour is key to unlocking revenue potential,” explains Sheridan. “When operators optimise their booking process—whether it’s by improving the online guest journey or offering flexible payment methods—they’re not only meeting guest expectations but also increasing per-guest spend. It’s all about making the experience painless and convenient for guests while driving more revenue."
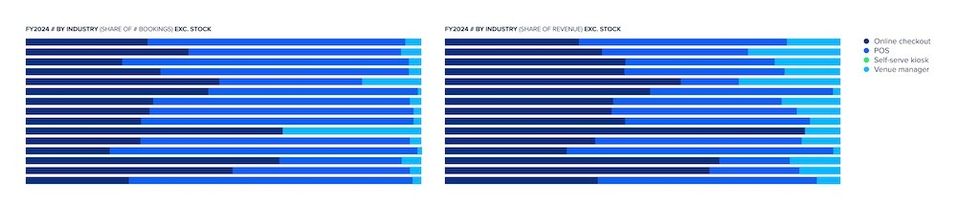
Online checkouts are on the up and up, with a third of all bookings being made through them. Online checkout revenue share was 64% in EMEA, 48% in APAC, and 29% in AMER. Of those online transactions, 83.3% were made on a mobile device. This trend towards online bookings is significant, especially as the report shows online checkout basket sizes are four times larger than POS, particularly for amusement and theme parks and competitive socialising venues.
Readers can dive deeper into this data in the full report for insights on topics such as online conversion rates, basket sizes by channel, popular purchases, revenue by day of the week and more. There are also strategies for increasing online booking revenue.
Parties, groups and memberships
Next, ROLLER’s Attractions Industry Benchmark Report takes a closer look at how party and group bookings fared in 2024 since these bookings can significantly impact revenue and unlock more sustainable growth.
According to the data, the majority of parties are booked 2-4 weeks ahead of time, meaning that operators have ample time to plan their targeted marketing. The average party size is 11.5-14.4 guests, with a bigger per-head spend for these visitors compared to a standard booking. Interestingly, party bookings have declined slightly, with a 3.1% YoY decline, however revenue has only dropped 1.1% in part due to higher prices.

Membership is a big trend in AMER, with 51% of venues offering it. These members visit a lot more than non-members – 261.5% more.
In addition to adding regular income, parties and memberships are vital to keeping visitors engaged and loyal. Speaking about how operators can make the most of these opportunities, as outlined in the report, Sheridan says:
“Releasing new products is always a daunting time, so the insights around memberships and party bookings should empower those looking to implement these recurring revenue streams to do so with confidence! We can see the effort of setting up these offerings is more than worth it, as they’re key drivers for customer acquisition & repeat business.”
Ultimately, the more ways that operators give their guests to engage with their attraction, the more opportunities they have to delight those guests and boost revenue.
Payments
One reliable method for operators to determine whether their attraction is headed for success in 2025 or if growth is expected to slow down is to look at payment preferences in 2024.
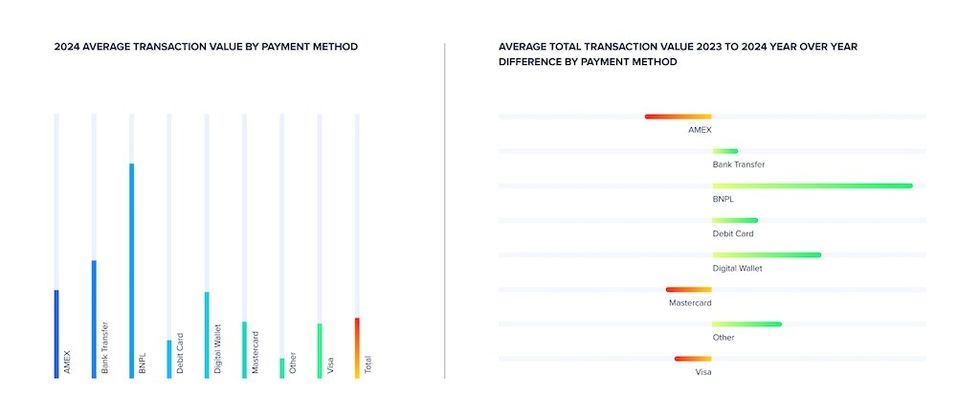
This sector of ROLLER’s report looks at how payments have fared in the industry. One of the most important lessons learnt is that providing flexible, contemporary payment options, such as digital wallets and Buy Now Pay Later, is not just a ‘nice to have’; it’s now necessary to maximise customer pleasure and increase transaction values.
Key findings indicate that digital wallets have grown significantly, with a 6.8% increase in EMEA. With larger overall transaction values than conventional card-based payment systems like Visa and Mastercard, digital wallets are gradually taking the lead in all regions. With basket sizes for digital wallets being 43.5% higher, venues that accept these newer payment methods benefit, highlighting how crucial it is to keep up with payment trends.
Furthermore, authorisation rates have increased across all regions, indicating easier and more effective guest payment procedures. Even though just 10.9% of venues charge credit card fees to patrons, knowing how fees impact the visitor experience will help operators make the right choice for their attraction.
By not offering flexible payment options, attractions could be leaving money on the table.
“Operators who prioritise modern, flexible payment options are positioning themselves for success,” says Sheridan. “Whether it’s digital wallets or Buy Now Pay Later solutions, offering payment flexibility can significantly impact transaction values. The data shows that guests are more likely to spend when they have easy, convenient payment options—making this a clear area for operators to focus on.”
Feature usage
Finally, ROLLER’s Attractions Industry Benchmark Report discusses feature usage, or how attractions use technology and venue management platforms.
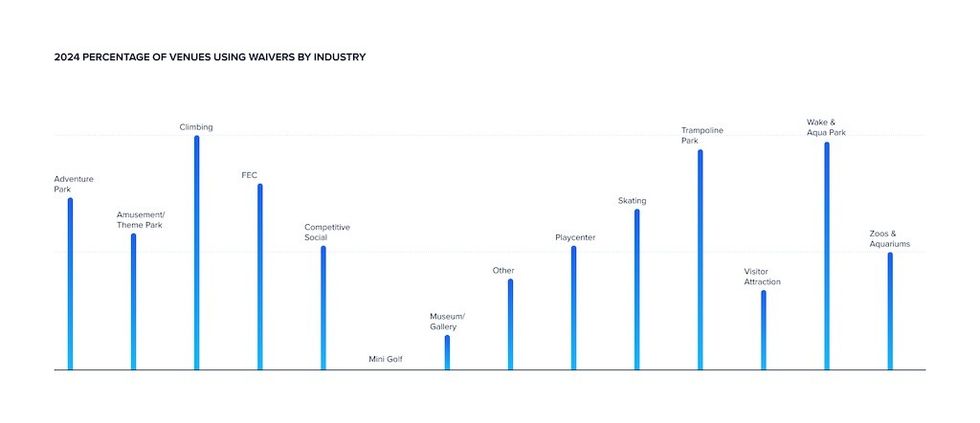
Various elements, such as digital waivers and online accounts, are becoming increasingly necessary for venues trying to simplify operations and lessen staff workload while guaranteeing visitors a seamless and fun experience.
One of the most important findings is that 68.2% of venues currently employ digital waivers, with adoption rates as high as 100% in physical attractions like climbing parks. Waivers are a no-brainer for any venue trying to increase check-in speed because they lower wait times while helping to mitigate risk.
89.2% of venues give gift cards to engage guests and foster loyalty, making them another effective tool. Meanwhile, 51.7% of venues utilise flags and bans, which allow operators to supervise visitor behaviour and guarantee compliance, creating safer and more regulated spaces.
23.8% of venues provide online accounts, another modern feature. By lowering the number of booking modifications employees must manage, these accounts save operators time and money while offering the degree of ease that today's guests demand.
Last but not least, data from guest reviews shows that visitors prioritise value, safety, and service, with cleanliness and friendliness coming in front. Concentrating on these areas can improve visitor satisfaction and make the experience more memorable for everyone.
“Maximising feature usage isn’t just about streamlining operations—it’s about enhancing the guest experience,” says Sheridan. “Tools like digital waivers, gift cards, and online accounts can reduce staff workload and improve efficiency, but they also create a smoother, more engaging experience for guests. It’s a win-win that directly impacts both guest satisfaction and revenue."
Key takeaways from the ROLLER Attractions Industry Benchmark Report
ROLLER created this report to offer operators a comprehensive look at the latest industry trends and provide valuable insights to help them drive more business success.
Some of the report's most interesting findings include the rise in online conversion rates, which show that attractions must have a seamless and mobile-friendly booking system to meet customers’ expectations. Another takeaway is that people spend more when booking online than in person, so it is vital that operators optimise their online booking processes to capture these transactions with minimal effort.
Additionally, more people are booking via mobile devices than ever before. This shows the necessity of ensuring that the online booking process is mobile-optimised. This online booking process must be available 24/7 since many online bookings are made outside of opening hours.
When it comes to parties, while bookings are down, pricing increases have softened the blow, meaning that operators need to make sure they have the right pricing strategy in place.
Finally, attractions should offer flexible payment options, such as digital wallets, which are gaining traction. This can increase guest spending and transaction value.
“The attractions industry and broader economic landscape is ever-changing,” says Finn. “We created the report to provide the community with proven trends and data to help them stay ahead and enter 2025 with confidence.”
To learn more about these findings and more, download the ROLLER Attractions Industry Benchmark Report here.