

by Michael Collins, Leisure Development Partners
All of LDP’s theme park and visitor attractions work, whether feasibility, improvement strategy or due diligence, is driven by benchmarking. We gather data on every key performance indicator (KPI) for all types of attractions, and when visiting any attraction, inevitably, as economists and consultants, we end up seeing our visit in terms of the data.
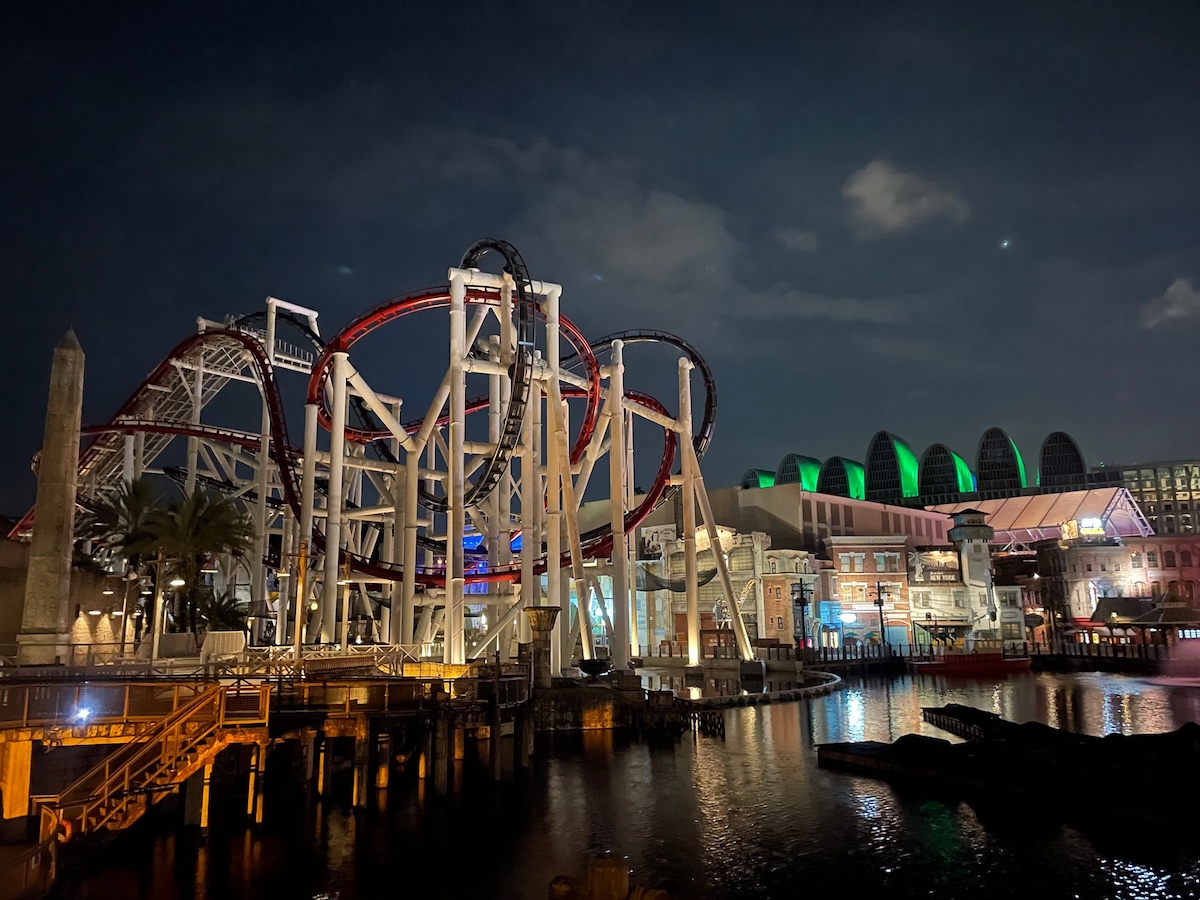
During the Easter holiday, I had the pleasure of visiting Universal Studios Singapore with my family. I promised them that we would just visit as regular guests and that I would not talk about work! I kept that promise. But inevitably, I was taking a few mental notes.
I thought it would be interesting to compare my visit with the benchmarks. When we benchmark theme parks like Universal, we need to look at the right comparisons with parks falling into a variety of categories, such as local/smaller parks, regional parks, branded parks, and destination parks. With multiple attractions on Sentosa, the Universal Studios brand and multiple resort properties, Universal Studios Singapore of course falls into the destination park category.
Here, we are comparing with other Universal Studios and Disney properties, as well as major theme park-anchored destinations in the top flight of the industry.
LDP’s in-house database has everything from penetration rates to per caps, staffing, and operating costs, but I want to concentrate on the revenue drivers related to our visit. Did my family behave like the mean, or were we outliers in some areas? Of course, we have to protect confidential information, so I am going to reflect on where our spending as guests is in relation to the range and averages for destination park KPIs rather than share details.
Length of stay
Length of stay (LOS) is a key driver of willingness to spend on admission – the longer the stay, the greater the value, and we benchmark entertainment value or price per hour to express this.
In addition, the longer you stay the more likely you are to consume food and beverage; a couple of hours stay may only entice visitors to have a snack or drink, four hours a meal and nine hours, maybe two meals or at least another snack.
At 5.5 hours, our stay was on the very short side for a destination park visit, with the norm being 8.0 hours plus. Blame the humidity, the jet lag, or the lure of a Singapore Sling in Raffles. As good as Universal Studios Singapore is, it has a more compact footprint than some other destination parks, and this also contributed to the shorter stay on this occasion, compared with the benchmarks.
Admission per cap and yield
At LDP, we examine several admissions-related KPIs, of which admission spend per capita and admission yield are most critical to our work. For readers who don’t use the KPI, admission yield is admission spend per capita expressed as a percentage of the undiscounted lead price.
Unfortunately for me, we were walk-up guests, had no discount codes and the age of my kids meant they entered as adults. Having paid the regular lead price of SGD 83 (USD 61), the admission yield on our tickets was 100%. At destination parks, there is significant regional variation, but generally, yields around the 50-60 percent range are more typical. I count this as a failure on my part and should have planned my visit rather than being a walk-up visitor.
Secondary spend
With a shorter-than-average stay, inevitably, our spending on food was not as high as some destination park visitors, but we did have a full meal.
Most destination parks have an average stay of 8 to 9 hours and, of course, generate demand for a meal and at least another snack. We could easily have stayed longer, and it is not for lack of great ride and show content that we cut our visit short. We had lunch and some soft drinks during the visit.
At SGD 24 (USD 18) per head, our spending on food and beverage at Universal Singapore is well within range for a mega park and actually not too far from the benchmark.
On retail, my kids played their part in buying souvenirs, including a branded electric fan, a water bottle and some confectionery. At an average of SGD 13 (USD 10) across the four of us, we were by no means big spenders – we were within the range but below the highest performers for mega park benchmarks.
We did not participate in any up-charges or buy photographs and only used free lockers, meaning a zero ‘other’ spend.
Total yield
One measure we like to use to gauge the overall level of spend is total per capita spend as a percentage of lead price. Most guests enter on some form of discount but then their secondary spend brings them up to or beyond the lead price. Typically for a destination park we might anticipate seeing total spend at around 120 percent of lead price, maybe a little more.
Given our lack of discount, at 144 percent, we blew this benchmark out of the water at Universal Singapore and were well above the norm.
Rides per hour
When preparing capacity estimates for physical planning analysis to inform master plans for new parks, we consider the experiences per hour a guest can expect on a design day (the average busy day we plan parks for. If parks are planned for the absolute peaks, they end up over-invested and under-performing).
While at a typical regional ride-based park with short-form experiences such as coasters and flat rides, we might anticipate 1.5 or so experiences per hour, destination parks have longer-form experiences and a lower number of experiences per hour.

At destination parks, many experiences are longer-format shows and may have elaborate pre-show experiences, all of which soak up time and entertain. As such, we typically expect to see 0.8 to 1.0 experiences per hour for destination parks.
We enjoyed 9 rides or shows in 5.5 hours, meaning 1.6+ experiences per hour. This is far higher than the benchmark and provided us with a great experience and great value from our visit to Universal Singapore. That ratio is aligned with what we would expect from a regional ride park.
At LDP we are hoarders of data – it is crucial for our analysis and forecasting. Our data enables us to go into in-depth detail for every type of KPI from attendees per FTE (full time equivalent staff member), to marketing spend per visitor, cost of sales, IP licensing costs and everything in between. We love the data behind the industry, but thankfully on this fantastic visit to Universal Studios Singapore, I managed to keep the KPIs to myself and to blooloop!


