


For you data hungry types out there, this is something for you '
If you know where to search on the web, you will be pleasantly surprised with what can be found. Since I have been providing economic and market research for several years, I know where most of the data are located.
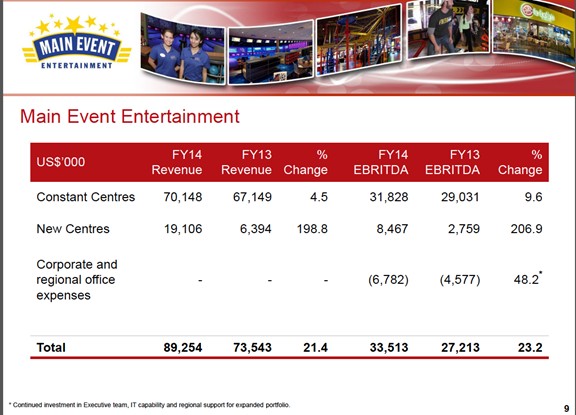
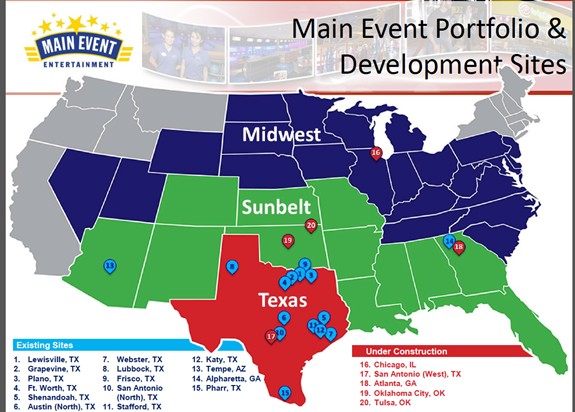
Take for instance, the detailed statistical data that are available on Ardent Leisure Group's website. Two of the documents I found particularly interesting are the Main Event Investor Presentation, a May 2014 report by UBS, and Ardent Leisure Groups FY 2014 Results.
Types of data that can be found in the publically available Main Event Entertainment Presentation include Revenue and EBRITDA over the last 15 years and also Average Center Revenues Compared to Best in Class Brands.
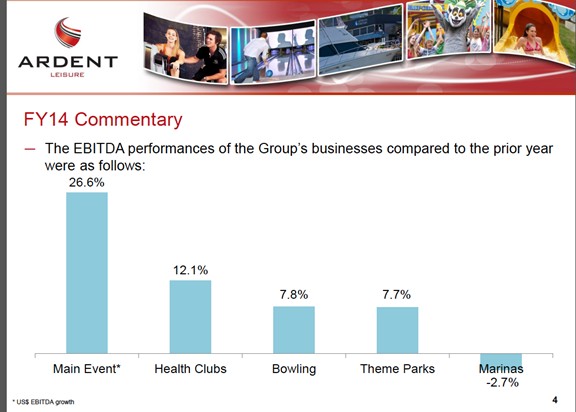
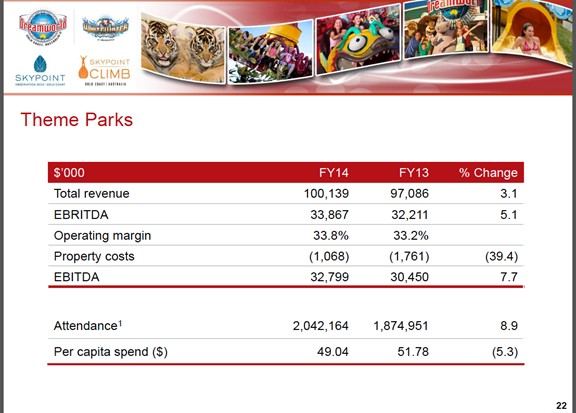
It is that time of year again when Ardent Leisure produces its FY 2014 report, which covers each of the Groups businesses (Main Event Entertainment (fec), Health Clubs, Bowing, Theme Parks, and Marinas) separately and then compares the performance with prior years.
As in previous Blogs, I have pointed out some of the tables which particular interest to the economic consultants, developers and operators in this group.
For instance '

Considering I supply research for consultants, developers and operators in the Leisure Time Industry, I tend to mostly be focused on a certain type of data. If you don't find what you're looking for, please check out Ardent Leisure Group's website for a goldmine of information.