
The Park Database team explores the topic of global tourism and take a closer look at EBITDA (Earnings Before Interest, Tax, Depreciation, and Amortization).
By The Park Database team
What are the most popular cities in the world for tourists, and why? And what can EBITDA figures tell us about park profitability?
Global Tourism
According to Mastercard, the most visited cities in the world are Bangkok and London, both of which generate more than 20 million international visitors a year.
Note that neither city has a branded theme park. This illustrates the fact that the reasons people visit cities around the world are both specific and varied. Despite these huge volumes, visitors may neither have the desire nor time to take a day out for a major attraction visit.
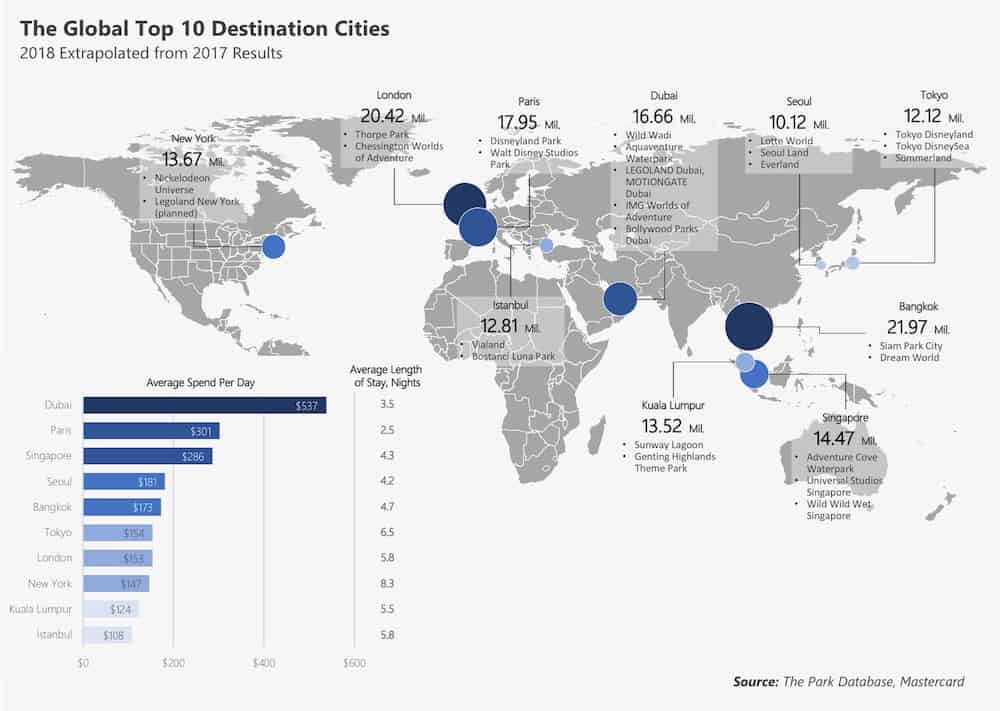
When looking at global tourism, the dynamics of visitors are important to consider as well. For example, visitors to Bangkok are often stopping over on their way to other Thai or Southeast Asian destinations.
Or, you could simply read this as a testament to our long-held belief that land prices are (almost) everything when it comes to attraction development. Both New York and London are among the costliest cities in the world. Here, developers have a huge hurdle to surmount in the form of land costs.
EBITDA
EBITDA has come under fire lately by investors for being subject to manipulation. Especially when companies “adjust” it every year for nonrecurring items. However, we still see the value in having a standard measuring stick for profitability before tax and financing effects.
Much could be made of the chart below. But we would focus on the following: does it seem that larger parks are more profitable than smaller parks?
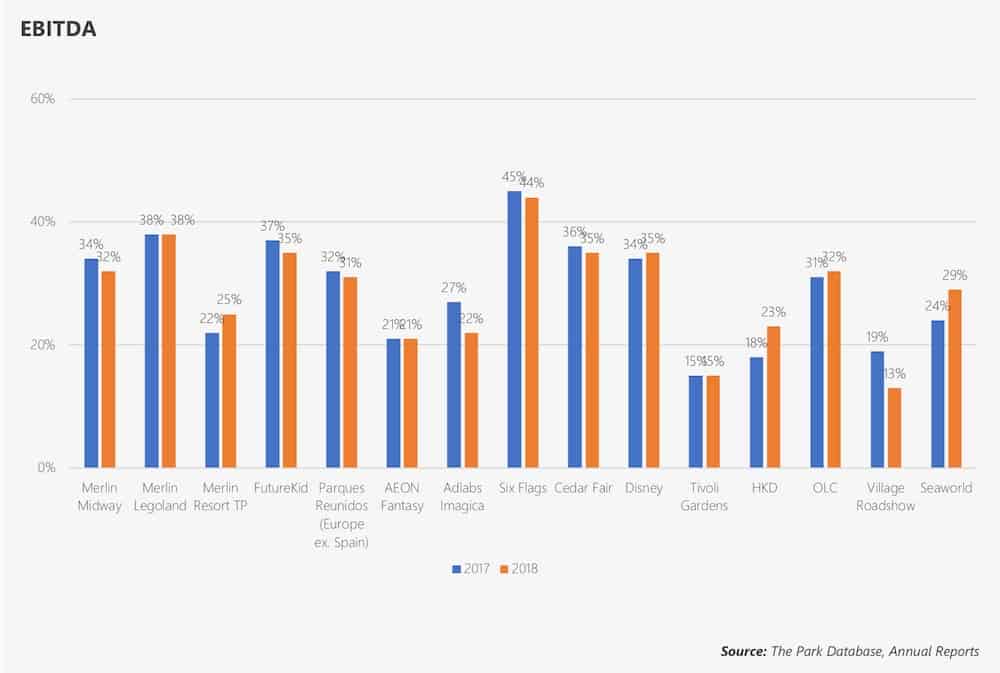
For example, the Legoland theme parks have a higher EBITDA ratio than its indoor (Midway) attractions. And the US brands – Cedar Fair, Six Flags, and Disney – have higher profitability ratios than smaller parks in Europe, Japan (AEON Fantasy), and India (Adlabs Imagica).
Secondly, even when we compare vastly different parks located in varying around the world, why is it that the profitability ratio hovers within such a relatively narrow range of 30-40%? Here we are referring to the Merlin, Parques Reunidos, Disney, Cedar Fair, Six Flags, and Disney chains. We would welcome all insight into this point.
Next week we will be exploring the trend for immersive experiences, as well as talking about attraction ticket prices.


