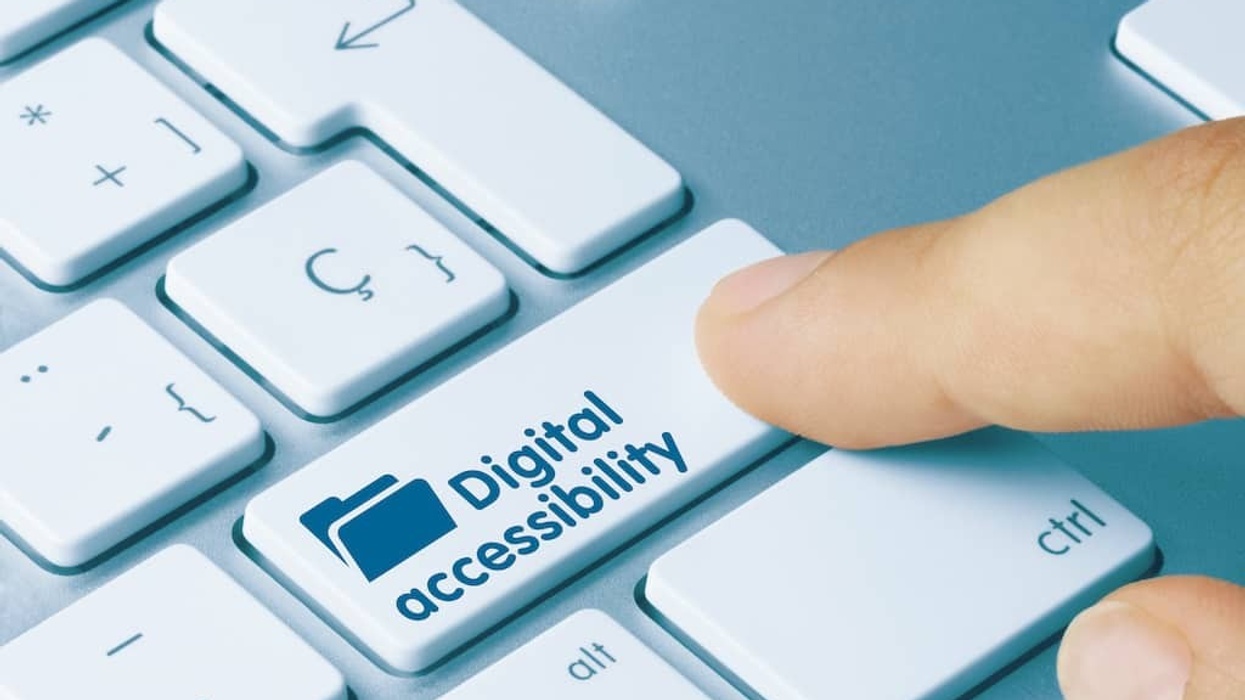
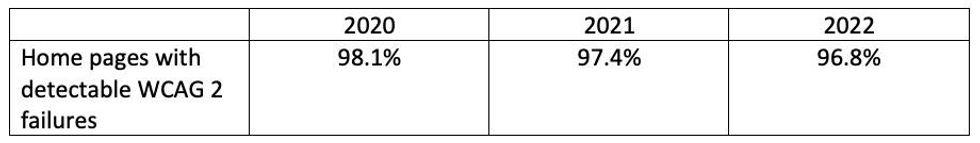
Internet-enabled online digital services are one of the best things to have happened for the world’s more than one billion disabled people (15% of the world’s population). However, 96.8% of the world’s top one million web homepages have digital accessibility errors.
The most prolific of these errors are poor contrast, which impacts many people with visual impairment, as well as images without a descriptive text, which confound the assistive screen reader technologies on which people with a variety of disabilities depend. These errors can significantly impact the usability of websites for people with disabilities and lead to the exclusion of many.
Exclusion is both a social challenge and a commercial one as it excludes disabled people from websites.
How does the visitor attraction industry compare with the accessibility of websites in general?
For over twenty years, the W3C organisation has published guidelines on the accessibility of websites.
The guidelines state:
"Following these guidelines will make content more accessible to a wider range of people with disabilities, including accommodations for blindness and low vision, deafness and hearing loss, limited movement, speech disabilities, photosensitivity, and combinations of these, and some accommodation for learning disabilities and cognitive limitations; but will not address every user need for people with these disabilities"
This report answers the question ‘how does the visitor attraction industry compare with the accessibility of websites in general’?
This report was initiated jointly by the author and blooloop.
Attractions can, and should, do more
Organisations in the attractions industry, especially theme parks and water parks, have the potential to make their websites more accessible for disabled people, thereby improving social inclusion and increasing customer numbers reached.
This report concludes that the visitor attraction industry could greatly improve the inclusivity of their websites for people with a disability. This would, in turn, also provide the potential to increase the customer base of the attractions.
Furthermore, it concludes that the websites of museums, while not completely error-free, are more accessible.
This report recommends that organisations take an inclusive approach to people/potential customers with disabilities. As a first step organisations should perform their own assessments of their websites to determine accessibility.
Theme parks and water parks have digital accessibility errors
96.8% of the world’s top one million web homepages contain digital accessibility errors; the digital accessibility of theme parks and water parks is comparable
This report was triggered by the generally poor state of digital accessibility of the world’s top one million websites. The WebAIM organisation conducts an annual survey of the world’s top one million websites, and then publishes its findings in the WebAIM Million report. The WebAIM Million report states that 96.8% of the top 1 million global websites’ homepages contain accessibility errors when evaluated against the W3C Web Content Accessibility Guidelines (WCAG) 2.1.
WebAIM's report does report on the digital accessibility of different industries. However, the visitor attraction industry is not one of the recognised industry categories. Therefore, it was jointly decided, in collaboration with blooloop, to perform a specific evaluation of the top 30 homepages in the visitor attraction industry (theme parks, water parks and museums ). This provides a unique industry perspective.

The high-level conclusions from this research are as follows:
- The digital accessibility of theme parks and water parks is poor, with all twenty homepages evaluated containing accessibility errors.
- The homepages of the museums evaluated were better, containing fewer digital accessible errors with two of the museum homepages evaluated containing zero errors.
- There is significant scope for the visitor attraction industry to improve the digital accessibility of their websites.
It is the experience of the author that many organisations are simply unaware of the poor accessibility of their websites. This is probably true for some, but not all, of the visitor attraction organisations.
Recommendations
This report recommends:
1. Organisations make digital accessibility a mandatory feature of their websites.
2. Organisations should establish the digital accessibility of their website by:
- For those organisations included in this year’s WebAIM million report, they can look up the results of the evaluation performed by WebAIM. A link is in the WebAIM Million report.
- Evaluate their homepages and potentially other individual webpages using the WebAIM WAVE tool. The WAVE tool has the added benefit of identifying individual errors together with detailed descriptions of the error and ways to make improvements.
3. Organisations determine how they should move forward. This could include the establishment of an organisational strategy and business case for digital inclusion, followed by then adopting a more inclusive design approach.
Methodology
This report aims to determine the digital accessibility of visitor attraction websites. 30 websites from the global visitor attraction industry were chosen.
These 30 visitor attraction homepages were selected from the TEA /AECOM Theme and Museum Index 2019. Ten homepages were selected from each of the categories used in the TEA Index (which is based on the number of visitors that attended the attraction and not visits to websites), namely:
- Top 25 amusement/theme parks worldwide.
- Top 20 water parks worldwide.
- Top 20 museums worldwide.
To improve the coverage, the selection process was further refined to ensure that key industry groups, such as Merlin, were represented. Additional refinements reduce duplications of attractions, e.g. removal of multiple Disneyland homepages that occur on the same website.
Finally, the number of museums within a single geography, such as London, was reduced.
Sample size
The primary reason for evaluating a small sample of 30 homepages was because the visitor attraction industry does not feature as a defined industry within the WebAIM Million report. To maintain consistency, the research undertaken to produce this report was closely aligned with the approach used by WebAIM in the production of its report. The report only evaluates homepages, as they provide a strong indication of the health of whole websites.
The research included detailed evaluations of 30 homepages performed using the Mozilla Firefox add-on version of the WebAIM WAVE tool. To quote the WebAIM description of their WAVE tool:
WAVE can identify many accessibilities and Web Content Accessibility Guideline (WCAG) errors, but also facilitates human evaluation of web content.
The report uses the same tooling used in the production of the WebAIM Million report to evaluate these homepages, i.e. the WebAIM WAVE Web Accessibility Evaluation Tool. Furthermore, the industry categories used in the production of the WebAIM Million report were determined to allow a level of consistency checking.
All data evaluated in the production of this report is in the public domain. In addition, all tools employed were free to use.
The data in detail
The trigger for this report was the WebAIM Million annual report which evaluates the top one million homepages in the world. Only 3.2% have zero automatically detectable errors when evaluated against level AA of the W3C Web Content Accessibility Guidelines (WCAG) 2.1. This figure is a slight improvement on the years 2020 and 2021.
Based on the limited sample of the 30 visitor attraction homepages evaluated the following table contains a summary of the results. The table contains the average number of errors and the range of errors detected in each of the three visitor industry subcategories of theme parks, water parks and museums.
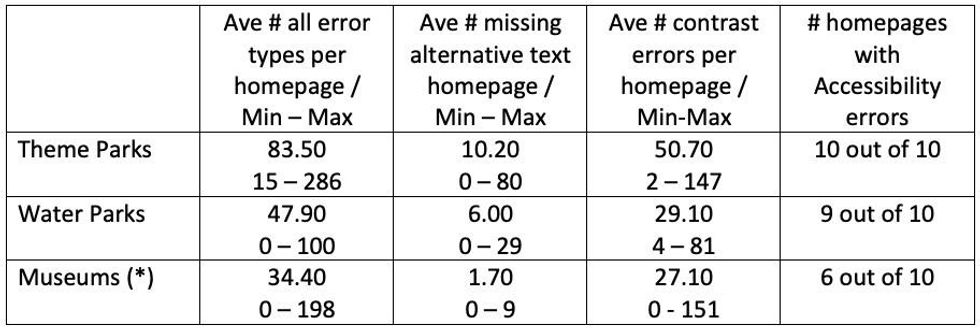
(*) The high number of contrast errors (151) on a single homepage distorts the average number of contrast errors for museums, thereby increasing the average.
It is not possible to correlate the above results absolutely with those in the WebAIM Million report. This is because the visitor attraction industry sits within in a multitude of industries such as travel and news & media.
Conclusions
However, the report draws the following conclusions:
- The homepages of the top visitor attraction industry sites do contain a large number of digital accessibility errors, i.e. non-conformance with the W3C Accessibility Guidelines. This also correlates to the findings of the WebAIM Million report.
- The most common error types that occur in the visitor attraction homepages are low contrast text together with images that lack alternative text that describes the image. This correlates to the findings of the WebAIM Million report.
- Low contrast errors. Adequate contrast of text is necessary for all users, especially users with low vision or those with colour-blindness.
- Missing alternative text means that images lack a text description field that would help people with sight impairments understand non-textual content. This error typically results in empty links and impacts screen reader assistive technologies. So, this adversely affects anyone who is dependent on the use of screen readers.
- Museums are more digitally accessible than water parks, which are more digitally accessible than theme parks.
- As stated previously, it was not possible to directly map visitor attraction websites to the industry categorisation used by the WebAIM Million report. However, using the same categories as the WebAIM Million report, 19 of the 30 websites are in the travel category and five of the museum websites are within the education industry. There is a loose correlation with the findings by industry in the WebAIM Million report i.e. the education industry websites have fewer errors than those in the travel industry. The WebAIM Million report used Web Shrinker to identify industry categories.
Accessibility information
Four of the 30 websites evaluated are aware of the importance of accessibility to their attractions. The fact that they publish guidance on the physical accessibility of their visitor attraction is evidence of this. Three of these four organisations' websites also describe the digital accessibility of their websites. However, only two of the 30 homepages evaluated have zero accessibility errors.
 Smell tour for the blind at Rijksmuseum ©CaroVerbeek
The evaluations of the organisation's homepages took place in April and May 2022, using the WebAIM WAVE Accessibility Evaluation Tool.
The report makes every effort to anonymise the evaluation results of individual organisations’ homepages. The results of the WebAIM evaluations for those homepages can be looked up using the WebAIM Million web pages look-up facility. Alternatively, and additionally, the free WebAIM WAVE Accessibility Evaluation Tool can help to evaluate homepages.
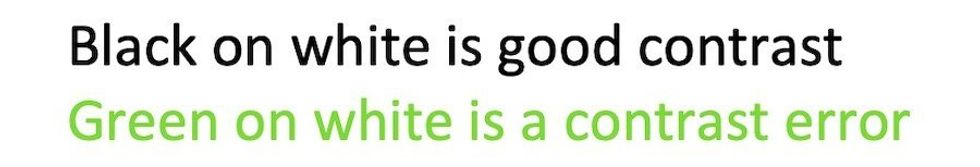
E xamples of digital accessibility errors
This section of the report contains deliberate errors. These serve as examples of the most prolific digital accessibility errors identified in the visitor attraction industry:
- Low contrast text
- Images that lack alternative text
These errors are also the most numerous error types in the WebAIM Million report. The WAVE tool will detect these errors when evaluating a webpage.
The following examples compare the difference between different colour contrasts.
The following examples are a green square that has alternative text to support screen readers. The red square has text that is visible to the naked eye but no alternative text.
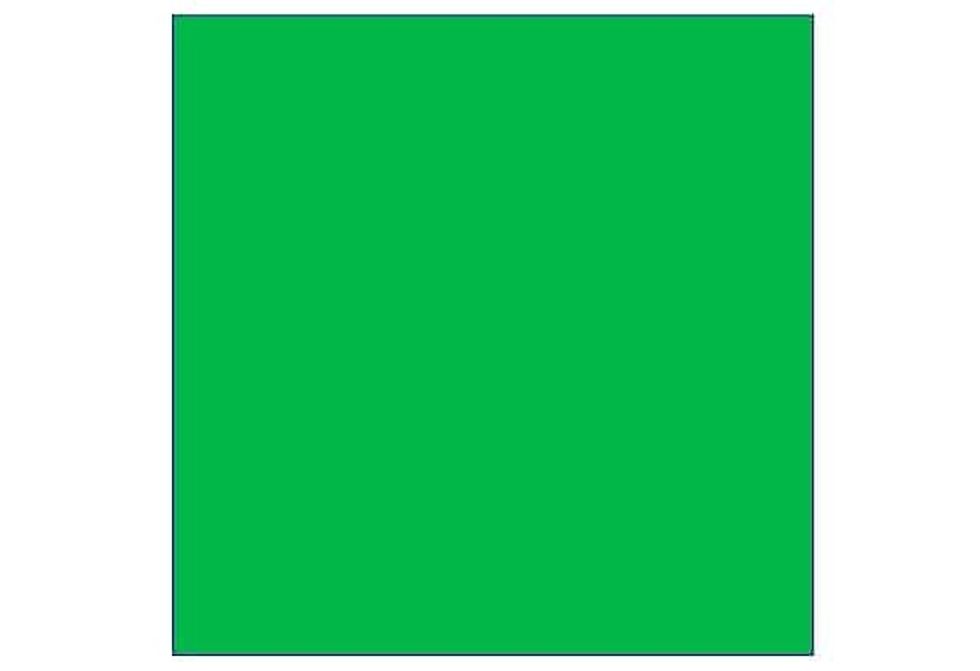
 This image has text next to it that is visible but it is not linked and will confound screen readers
Peer reviewers
The peer-reviewers of this report are:
- Jared Smith, WebAIM, Institute for Disability Research, Policy and Practice
- Dr Kira Allmann, Ada Lovelace Institute and Ambassador for the Digital Poverty Alliance
- Dr Maurice Perks FBCS CITP, an Independent IT Consultant and a former IBM Fellow (retired)