Attraction design firm PGAV Destinations and research firm H2R Market Research have published their 4th annual Voice of the Visitor: Outlook on the Attractions Industry report.
Americans are traveling less frequently and are returning to attractions less and less – often in search of something new and welcoming. The results of PGAV’s fourth-annual Voice of the Visitor: Outlook on the Attractions Industry which tracks Americans’ travel behavior and forecasts future plans, revealed a dramatic shift in the demographics of attraction visitors, and a deep desire to visit places that make them feel welcome and relaxed.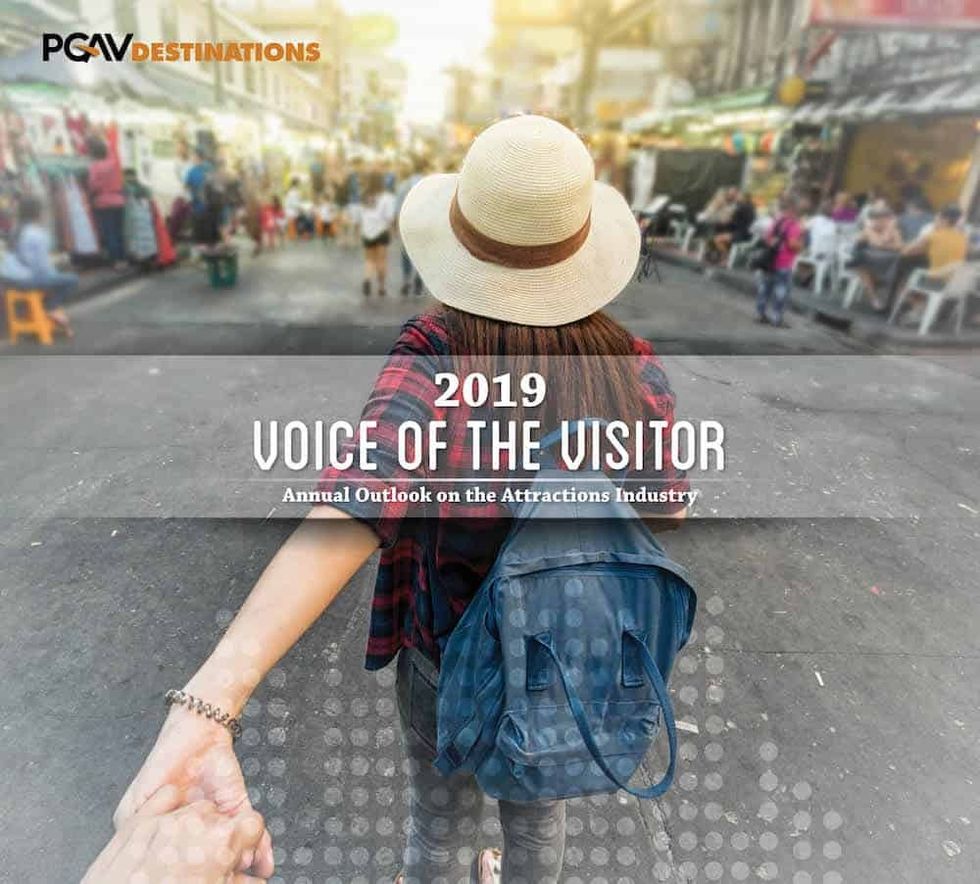
However, compared to the current racial majority, these groups are eight percentage points less likely to travel for leisure, seven percentage points less satisfied with their last attraction experience, eleven percentage points less likely to recommend that attraction to friends or family, and are five percentage points less likely to travel in 2019.
Voice of the Visitor 2019
“I was amazed how accurately PGAV’s Voice of the Visitor 2019 was able to forecast the upcoming trends of our visitor behavior,” says Beth Hill, President and CEO of Fort Ticonderoga. “The report is my go-to resource to aid in my annual planning, helping to better anticipate guests’ interests and needs, and crafting life-changing experiences that help inspire a passion for the Nation’s history.”
When Americans travel, trends suggest that they are seeking more peaceful time with friends and family to relax, an ideal quality of numerous attractions across the country, such as National Parks, Museums, and Botanical Gardens. Compared to five years ago, Americans note that they are “relaxing and chilling out” 27% more, playing video games 10% less, spending time outdoors 16% more,and hanging out with friends online 5% less.
With more options for entertainment, consumers’ tolerance for bad service and low-fidelity experiences continues to decline. Fortunately, annual staff retraining is often a simple program to reinstate, building staff camaraderie, refreshing attraction teams on mission and purpose, and educating on the latest needs and wants of their guests. Attractions are also frequently evaluating the success of their exhibits, rides, and more, and evolving existing offerings while planning renovations and expansions to meet guests’ expectations.

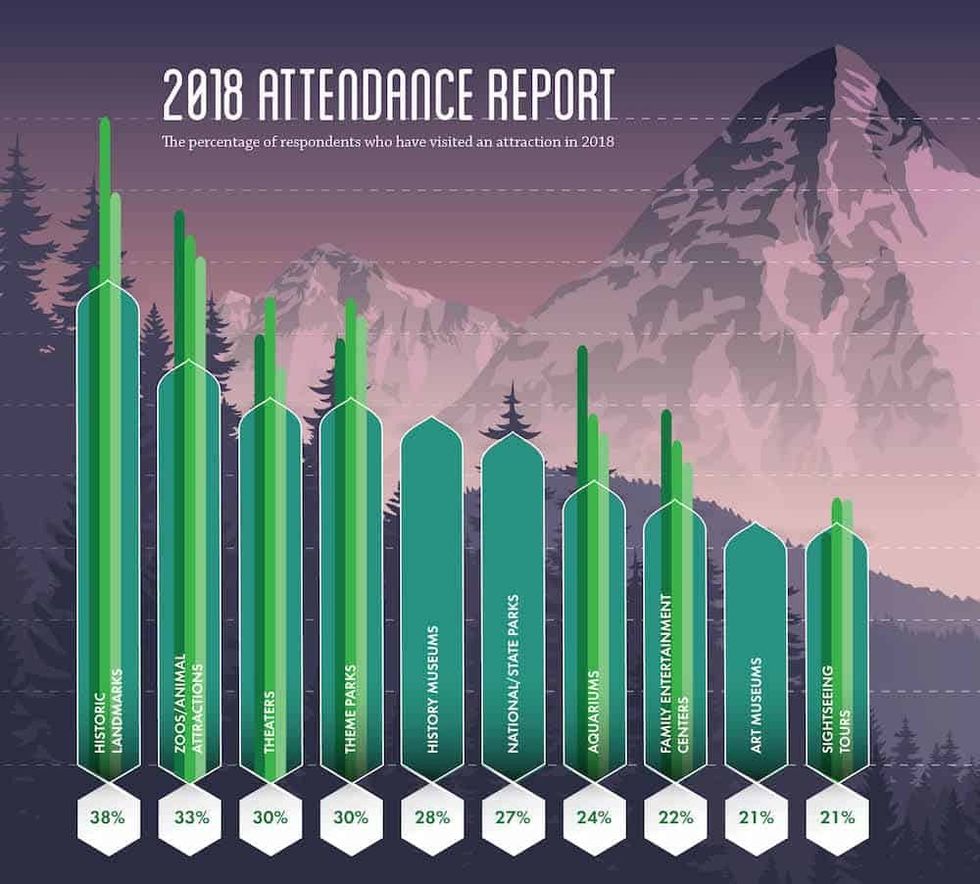
Top 10 attraction types visited in 2018
1.38%: Historic Landmarks2. 33%: Zoos/Animal Attractions 3.30%: Theaters4.30%: Theme Parks 5.28%: History Museums6. 27%: National/State Parks7.24%: Aquariums8. 22%: Family Entertainment Centers9. 21%: Art Museums10. 21%: Sightseeing Tours
Top five most important factors for American tourists
1.79%: It’s a good value for the money2. 78%: It’s a clean place to visit3.71%: It has friendly staff members4. 70%: It provides a safe and wholesome environment5. 69%: It’s a diverse experience with a lot of differentthings to see and doA digital edition ofVoice of the Visitor is now available for free at https://www.pgavdestinations.com. For dozens of additional, free tourism studies by PGAV Destinations, visit https://pgavdestinations.com/insights/
Methodology
Conducted by H2R Market Research, Voice of the Visitor interviewed 1,500 American respondents who either visited an attraction in 2018 or plan to do so in 2019, providing a margin of error of +/-2.5% at a 95% confidence interval.